The trucks are back. The lanyards are in a bin. Everyone's caught up on sleep, and now you're sitting in front of a folder full of spreadsheets, housing exports, member rosters, competitive event reports, wondering what you're actually supposed to do with all of it.
Most association leaders look at that pile, pull out the attendance totals for the board report, and move on. That's understandable. Post-conference is exhausting, and the next one feels far away.
But here's the thing: the data you have right now is the most useful planning tool you'll touch all year. Raw numbers won't tell you how many hotel rooms to block or which chapters are quietly falling behind, but the patterns inside that data will, if you know what to look for.
That's what #SummerofData is about. We'll walk through how to use your CTSO data, housing lists, membership numbers, competitive event reports, to actually forecast what next year needs to look like. And we'll cover how AI tools can do most of the heavy lifting, no data background required.
Stop Guessing Your Space Requirements
The old approach: take last year's attendance, add 5%, and send that number to your venue contact. It's a guess wearing a spreadsheet costume.
Your housing data tells a much better story. Look at when your room block filled. Were chapters pushed into overflow hotels because your primary block ran out before cutoff? Did certain room types, doubles, accessible rooms, disappear faster than others?
Those details aren't just operational footnotes. They're negotiating leverage.
Use Housing Trends to Negotiate Better Contracts
Walking into a venue conversation with specific data is completely different from walking in with a rough estimate. "We filled our room block 11 days before cutoff and placed 47 delegates in overflow" isn't a request for more rooms. It's a justification. That's a position of strength.
The same logic applies to your convention floor plan. If your general session ran at 95% capacity and two breakout rooms needed overflow, you have a real case for more or larger space next year. Your data makes that case for you.
Pull it this week. Flag where you hit ceilings. Write it down before the details get fuzzy.
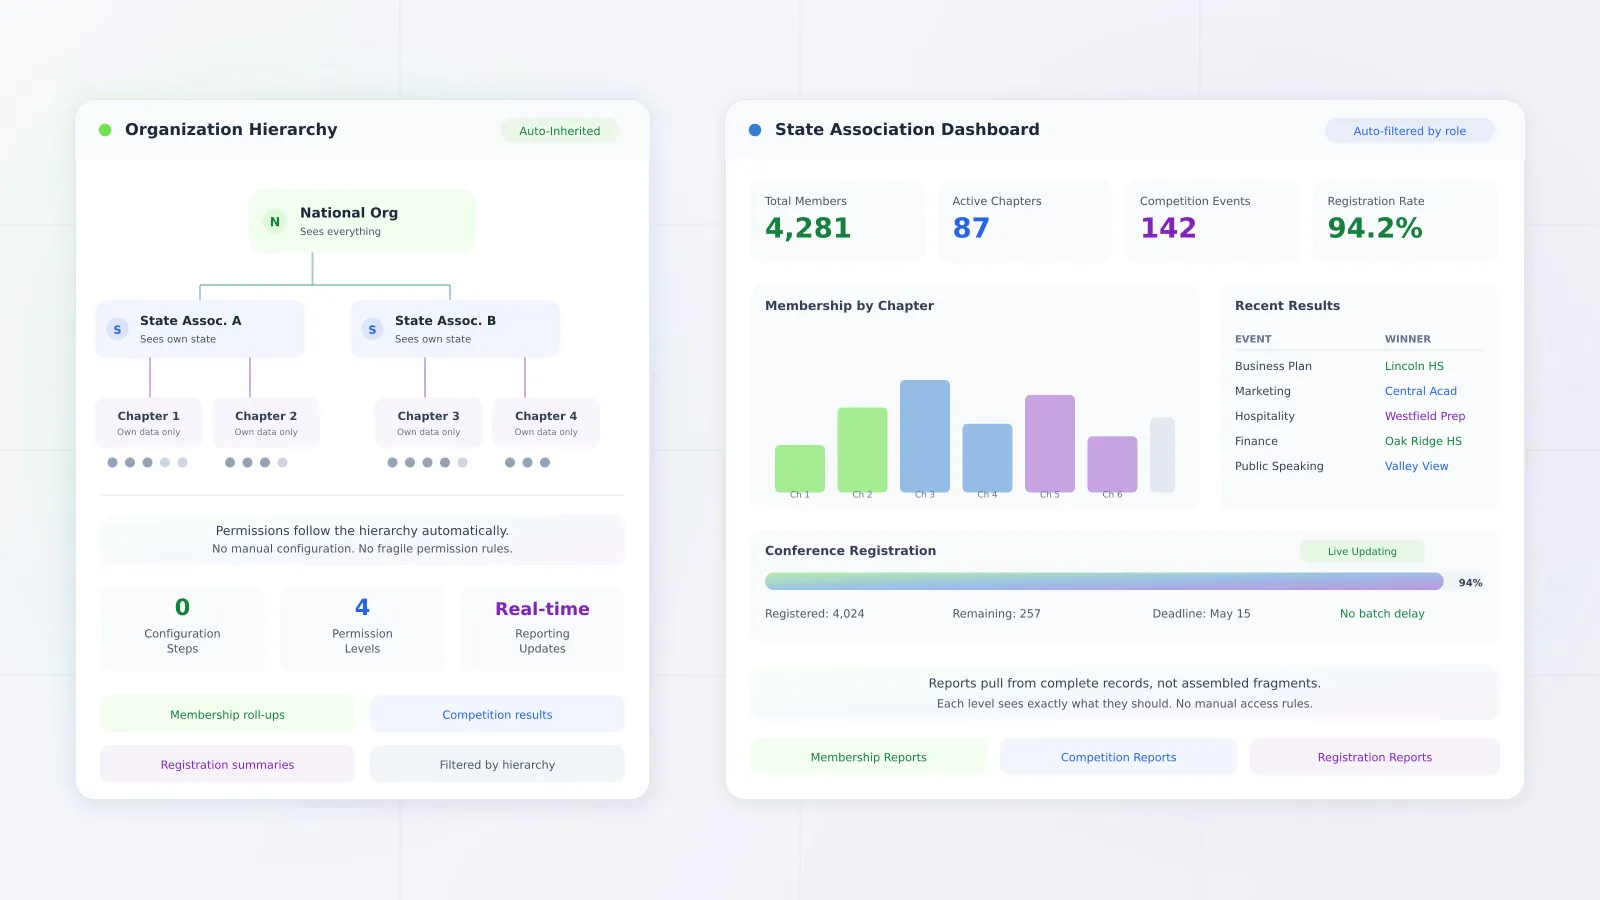
Mining Your CTSO Data for Event Gaps
This is where most of the real growth opportunity hides, and where most leaders miss it, because they review membership data and event reports separately.
Put them side by side. The picture changes.
The Membership-Participation Gap
Here's a pattern worth looking for: a chapter doubles its membership from one year to the next, but brings the exact same number of students to state conference. Same events, same headcount, same footprint.
That gap isn't random. It usually means the chapter is adding members without activating them, and nobody noticed because the two reports were in different tabs.
When you look at your CTSO data this way, those gaps show up clearly. And gaps you can see are gaps you can address.
What Waitlists and Maxed-Out Events Are Telling You
Check which competitive events hit their cap this year. Any waitlists? Any categories where students got turned away?
That's not a capacity problem. It's a demand signal. It means chapters will show up next year expecting those spots. If you don't plan for it, you'll be scrambling the week before conference. Better to plan now: more judges, a larger room, maybe a new event category that absorbs the overflow.
Let AI Do the Heavy Lifting
Here's where a lot of association leaders check out: "I'm not a data analyst, and I don't have time to become one."
Fair. You don't have to be.
Tools like ChatGPT and Claude are genuinely good at this kind of work. Think of them as a sharp assistant who can read through your exported files, spot patterns you'd miss, and write up a plain-language summary, in about the time it takes to make a cup of coffee.
You're not writing code. You're writing a question.
The Prompt You Can Use Today
Export your competitive event participation and membership numbers as an anonymized CSV. Drop it into ChatGPT or Claude. Use this:
I am managing a student association. Based on this anonymized CTSO data, identify the top three growth trends in competitive event participation over the last two years. Then, forecast our hotel room block needs for next year assuming a 15% overall membership growth.
What comes back is a structured analysis you can drop directly into an executive summary or present to your board without translating anything first.
No consultants. No formulas. Just your existing data and a well-asked question.
Your Data Is a Roadmap, So Read It
The CTSO data sitting in your post-conference folder is one of the best planning tools you have. It shows you where you're growing, where you're leaving capacity on the table, and where chapters are adding members without converting them into active participants.
It only works if you use it.
Here's where to start this week:
- Pull your housing report and note where room blocks capped out or where delegates ended up in overflow.
- Lay membership numbers next to event participation data and look for chapters with growing rosters but flat conference attendance.
- Review competitive event reports for waitlists or categories that maxed out.
- Run the data through an AI tool using the prompt above, then use what comes back to start venue conversations early.
Don't wait until October when your venue needs a commitment and the details have faded. The data you have right now is enough to walk into that negotiation with confidence.
Share what you find with the #SummerofData hashtag. We'd genuinely like to see what surfaces. And if you're heading into venue negotiations, take a look at our guide, Venue Contract Pitfalls for CTSO Association Leaders, so the insights you just uncovered actually hold up when the contract language gets specific.